Now I'm home and the hard work starts... working on our site goals and preparing for the new year!
Wednesday, June 25, 2014
AVID Summer Insititue - Day 3
Day 3 had us in our strands for one last time, then for my site team, we had a "mobile" site team meeting as we drove home from Dallas. :) Here are my notes from today:
We started out talking about how to use the critical reading strategies in a 1:1 classroom. Of course, with tablets, you can pretty much annotate right on them, but with Chromebooks, that would be more challenging.
Yesterday we worked on summarizing, today we looked at Macro and Micro structure of text. I understand the general point of Macro/Micro, but I'm not sure how to apply it to math effectively. With the Micro, the saying/doing activity was interesting but difficult as my idea of what the author is doing was definitely different than an ELA teacher perspective.
One idea I am totally stealing is "Sticker Props". A page of stickers showed up on our table, but it wasn't until later that the presenter shared what they were for. Apparently, when her kids work in groups, she puts a small sheet of stickers in the middle of the table. If a group member has a profound statement or an "a-ha" moment, they get to choose a sticker. I love this idea!
One activity I used as an elective teacher was the "One-Pager". The presenter suggested having students create a One-Pager via Google Draw if you are in a 1:1 environment. Draw is one of the tools of G-Drive that I haven't used, so that may need to be explored soon!
One of my favorite strategies we used today was a pre-reading strategy called Vocabulary Connections. The presenters had chosen 8 vocabulary words from the text and displayed them on the screen. We were asked to create a sentence using as many of the words as we could. I found it fascinating to hear the different sentences and combinations of words from my table-mates. I'm not sure how it would work in most math classes though...
Our final activity of the day was a Socratic Seminar. I've done SS's before, but one new twist that the presenter shared today was charting the conversation. Basically, she drew a circle on her iPad to create a "seating chart" of the circle. Then she drew lines from person to person through the circle to illustrate the conversation. The major benefit was that it allowed her to monitor the conversation and see who dominated the convo, who was quiet, and when two or more people were engaged in a debate.
Now I'm home and the hard work starts... working on our site goals and preparing for the new year!
Now I'm home and the hard work starts... working on our site goals and preparing for the new year!

Tuesday, June 24, 2014
AVID Summer Institute - Day 2
Day 2 at AVID SI started in our strands at 8am, then after lunch we worked with our site teams. I felt that today was a very productive day overall and I'm very pleased with our progress.
Here are my take-aways from today:
We started the day briefly discussing Cornell Notes, which is a staple of the AVID program. One of the ideas that was shared was regarding the Curve of Forgetting and how C-Notes can help with retention of material. One of the presenters uses a C-notes review as a warmup activity and asks her students to get out their C-Notes from yesterday's lesson/lecture and with an elbow partner, review/revise their notes. This would also be a good time to work on left-column or summarization.
Whenever we have done a quickwrite, one of the presenters always ends the last 10 seconds with "You have 10 seconds left.. finish your last though.. finish your last sentence.. finish your last word... and stop"
We did a Philosophical Chairs activity today, so I tweeted out asking for ideas on using them in math. I haven't had much response yet.. :(
Marking the text in math - I think I want to get into the habit of "circling key terms and underlining claims". In my class, that would be "circling key information" as in the important details of the problem and "underlining the question being asked". I am hoping that if I get my students in the habit of doing this, it will help them tackle new problems and gather the important information.
Modeling is KEY! I realized today that math teachers do a good job in general of modeling our internal dialogue that occurs when we tackle a new problem. However, in our strand, some of the strategies were used with the thought that we already knew what was going on. I understand that teaching children is different than teaching degreed adults, but modeling your expectations is important no matter what the age of your students.
We ended the day talking about summarizing strategies. I don't know how to use that yet, but one idea I had was to have some sort of gallery walk to illustrate different summary sentences of the same paragraph. When we were writing a one sentence summary for a paragraph of test, I was very anxious about whether I did it right. I know there wasn't a right answer, so I think seeing other sample student responses would have helped me to relax a bit.
One of the ideas for teaching summary skills reminded me of an idea from Embedded Formative Assessment. The presenter mentioned giving several samples of summaries and having students rank them by quality. I don't know if I like this idea or not since it can be very subjective...
Tomorrow is Day 3, then home we go! :) Have a great day!
Here are my take-aways from today:
Tomorrow is Day 3, then home we go! :) Have a great day!
Monday, June 23, 2014
AVID Summer Institute - Day 1
Yesterday afternoon, I loaded up with 9 of my colleagues to make the drive to Dallas for my 7th AVID Summer Institute. Throughout the years, I have been to the Mathematics strands, Elective Teacher strands, Leadership strands, and this year I am really excited to be in the Critical Reading strand. I had several people today look at me funny when I introduced myself as a math teacher in the Critical Reading strand, but I'm really excited to learn strategies that I can use in my classroom!
Taking a note from Sarah H over at MathEqualsLove, I'm going to try to jot myself some notes from today's session so that I can visit it later...
ALL teachers are teachers of reading and writing. This is something that I often forget. For obvious reasons, I identify as a math teacher but honestly, it is part of my job to teach students how to read a math text or how to write a mathematical argument. I need to integrate these skills more often.
One of the first strategies we worked on was marking the text. To be honest, this was NOT a skill I learned in high school or college. If you were to look at my college history books, it looked like a highlighter blew up on the paper because I had no idea how to interact with the text. Once I became an AVID elective teacher, this was a skill that I was required to teach to my students, only we called it annotating at that point. I turned to one of my ELA friends who also taught AVID with me and I'll never forger how she explained it to me. She told me to think of the text as a movie and anytime I got an urge to "nudge" the person beside me and say "OMG, did you see that!!!", then it was something that I needed to underline and write in the margins. If you were to look at my #EduRead archive of articles, you would see evidence of how I interact with text... usually through underlines and margin notes, but sometimes highlighting for something vital. I need to create opportunities for students to interact with text in my classroom. In AP Stat, we often have students read an article or a textbook passage, but I have not taught them how to be an active reader.
Pre-Reading strategies... this is a "duh" moment for me, because I knew that we should always try to activate prior knowledge. However, I never really knew what that meant! Today we did several pre-reading strategies such as the ever popular Quick Write with a relevant prompt, but one of my favorites was a set of "Interview" questions where we paired up and had a short discussion over questions that related to the text we were going to read.
Sentence Starters... OMG, I think this will be a game changer for me! Our presenter gave us a sentence frame that said... "In ____ (title of text), (Name of Authors) _____ (claim, state, argue, or some other verb) that ______." The presenter said that she was dreading grading 100s of sentences that were the same, but she decided to try it anyway. She gave the students a few minutes to complete the sentence, then had them table-share and choose one person to share with the whole class. All of the sentences were different, even though the structure and article were the same. One of the presenter's students exclaimed, "Miss! We sound so smart!!". The presenter's point was this... We expect kids to write academically when they don't know what that looks like. With the sentence frames, we provide structure to help them learn academic writing. Chalk up another DUH moment for me!
As one of the samples from reading in math, we did some graphs... I need to search out good infographics for students to read, notice, wonder, etc :)
One management strategy that I really liked was how the presenter brought us back from a group discussion. In the midst of the chaos of chatting about the task at hand, she would very loudly say, "Back to me in 5...4...3...2....1". It was very effective and I'm eager to try it.
I know I learned a lot more, but those were my major take-aways from today :) Day 2 is tomorrow!
Taking a note from Sarah H over at MathEqualsLove, I'm going to try to jot myself some notes from today's session so that I can visit it later...
I know I learned a lot more, but those were my major take-aways from today :) Day 2 is tomorrow!
Monday, June 16, 2014
#Made4Math - Knowledge Rating Chart

Sorry that my Made4Math project is a bit late tonight, but I've been at the AP reading since last Tuesday and days of the week really mean nothing here! :) To give an example, I had at least 3 people lined up to send me a reminder to call my dad yesterday for Father's Day because all I knew of yesterday was that it was "Day 5". To make matters a bit tougher, the internet at the hotel is severely lacking plus the only computer I brought with me is a Chromebook, which I'm just learning to use! So tonight after the reading, I came home to work on my project and had to figure out how to use Google Docs and take a screenshot on the Chromebook in order to share this with you! :)
One of the books that I picked up a few years ago at Half Price Books (LOVE that place!) was the book Algebra Out Loud by Pat Mower. Since one of my goals this year is literacy, I brought the book with me on the trip and have been reading through it trying to figure out ideas to use in Statistics. One of the activities is a Knowledge Rating Chart, so I did some research and found some great examples on Math Equals Love. If you don't follow Sarah's blog, please go do so now! I'm lucky enough that I live near her, so we've met up several times and that girl is amazing! I wish I had been half as good as she is after only 2 years of teaching!!
Anyway, after reading Sarah's blog and talking with her on twitter, I came up with this Knowledge Rating Chart for AP Stat:

The idea is that students will put an X in each box if they feel confident in their ability to do that task. I am thinking it might be a good "temperature check" during the sampling chapter to make sure students are on target with their knowledge.
Monday, June 9, 2014
#Made4Math - Door Sign
I'm so excited that #Made4Math is back for its third summer! If this is your first #Made4Math, it was started as a way to help keep me accountable for all of the to-do projects that I wanted to do over the summer. Hopefully, I'm not the only one that thinks... "oh, what a great idea! I'll do that this summer!" Then August comes, and none of those projects got done... :(
Anyway, here's my first project of the summer.. a door sign!
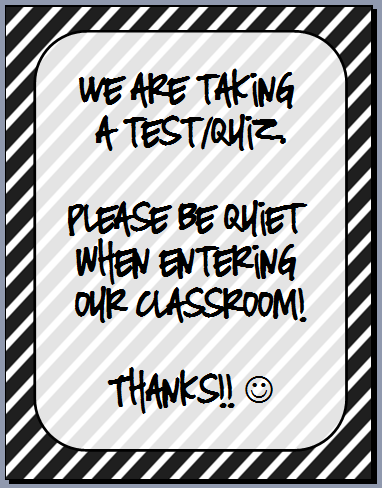
One of the things that really bothered me this year was the constant stream of visitors on test/quiz days. For some reason, every test/quiz day seemed like it was newspaper delivery day or a day of many office passes. The part that *really* bothered me was that the pass deliverers were rarely quiet. They would let my door bang shut or be loud as they opened the door or something that disturbed my students. Very frustrating! :(
Hopefully the sign will remind them to be QUIET...
Project #1 DONE! :)
Saturday, June 7, 2014
Comparison Matrix
I have a lot of goals for this summer, but one is definitely to reconnect with my professional learning. I struggle through the school year to keep up with reading professional books and literature, even though I know how much I benefit from them. This struggle was the reason that #eduread started, but now that summer is here, I also have started browsing some long-neglected books in my library.
One such book has been sitting on top of the bookcase in my bedroom for at least 2 years. I purchased "A Handbook for Classroom Instruction that Works" several years ago for $2.50 at a used book store in town, but other than casually flipping through it, I hadn't really opened it up and read it. Last week, on the way to my mom's house, I finally took the opportunity to start reading the book. I'm not very far into it because the first section caused me to pause and reflect! :)
Module 1 is on Comparing. Most of the module focused on how to teach students to compare, especially using everyday comparisons and the ever popular Venn Diagram. However, on the pages following the Venn, the author introduced the Comparison Matrix. This was the first time I had seen the Comparison Matrix and immediately I thought that it might be a useful organizational structure in my AP Statistics class to introduce comparing distributions.
In AP Stat, one of the topics that students are expected to be able to do is compare two or more distributions in terms of Shape, Odd Features, Center, and Spread. Having been an AP Teacher for 14 years and an experienced AP Reader, I know that this expectation is easier said than done. More often than not, students give a "laundry list" of attributes rather than a comparison. In order to compare two distributions, students need to use comparative language... higher, lower, wider, narrow, more spread out, etc.
For example:

The above graph is from a previous AP Statistics Free Response Question and part of the question asked students to compare the distances traveled by a Ping-Pong ball launched from the two catapult designs. It is all too common for students to literally list the shape, center, and spread for the distributions and totally ignore the fact that Catapult B seems to be more consistent as shown by the smaller range and on average, Catapult B seems to go slightly further than Catapult A. Ideally we would like for students to mention this comparative aspect of which dataset is more/less spread out and which dataset has the higher/lower center.
So, as I was reading the "Handbook" and ran across the Comparison Matrix, a problem like the Catapult problem immediately came to mind. I jotted myself a few notes and then when I got home that evening, created this:

The idea is to use this to help guide my students thinking and hopefully they will realize that a "laundry list" isn't enough! The top boxes are for them to create the laundry list and make sure they remember all of the important attributes. Then, they have to communicate and compare the distributions using comparative language. Hopefully this organizational scheme will help some of them think through their descriptions of data... :)
One such book has been sitting on top of the bookcase in my bedroom for at least 2 years. I purchased "A Handbook for Classroom Instruction that Works" several years ago for $2.50 at a used book store in town, but other than casually flipping through it, I hadn't really opened it up and read it. Last week, on the way to my mom's house, I finally took the opportunity to start reading the book. I'm not very far into it because the first section caused me to pause and reflect! :)
Module 1 is on Comparing. Most of the module focused on how to teach students to compare, especially using everyday comparisons and the ever popular Venn Diagram. However, on the pages following the Venn, the author introduced the Comparison Matrix. This was the first time I had seen the Comparison Matrix and immediately I thought that it might be a useful organizational structure in my AP Statistics class to introduce comparing distributions.
In AP Stat, one of the topics that students are expected to be able to do is compare two or more distributions in terms of Shape, Odd Features, Center, and Spread. Having been an AP Teacher for 14 years and an experienced AP Reader, I know that this expectation is easier said than done. More often than not, students give a "laundry list" of attributes rather than a comparison. In order to compare two distributions, students need to use comparative language... higher, lower, wider, narrow, more spread out, etc.
For example:

The above graph is from a previous AP Statistics Free Response Question and part of the question asked students to compare the distances traveled by a Ping-Pong ball launched from the two catapult designs. It is all too common for students to literally list the shape, center, and spread for the distributions and totally ignore the fact that Catapult B seems to be more consistent as shown by the smaller range and on average, Catapult B seems to go slightly further than Catapult A. Ideally we would like for students to mention this comparative aspect of which dataset is more/less spread out and which dataset has the higher/lower center.
So, as I was reading the "Handbook" and ran across the Comparison Matrix, a problem like the Catapult problem immediately came to mind. I jotted myself a few notes and then when I got home that evening, created this:
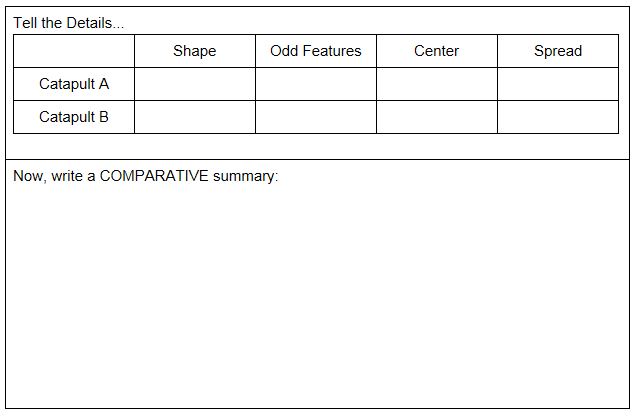
The idea is to use this to help guide my students thinking and hopefully they will realize that a "laundry list" isn't enough! The top boxes are for them to create the laundry list and make sure they remember all of the important attributes. Then, they have to communicate and compare the distributions using comparative language. Hopefully this organizational scheme will help some of them think through their descriptions of data... :)
Monday, June 2, 2014
Made4Math is BACK!
Wow! What a year! It was an awesome year with a great group of kids, but man, I am *exhausted*! I took on two new preps this year and a few new administrative responsibilities, all which added up to a very busy year!
All excuses aside... Summer is HERE! And that means #Made4Math is BACK! :)
What is #Made4Math?!?!?
#Made4Math was started a couple of years ago by @druinok and @pamjwilson as a way to help us organize and plan for the upcoming year. If you have been a teacher for any length of time, you know that throughout the spring semester, you think "I'll tackle projects X, Y, and Z during the summer.. I'll have PLENTY of time then!" Of course, that time goes away VERY quickly and before you know it, August is looming and none of your summer projects are completed! #Made4Math is here to help you have a bit of accountability in tackling those projects. :)
A few simple rules
1) Make something for your classroom! This could be a new decoration, an activity, etc and share it with us by blogging about it, then submitting your post to #Made4Math!
2) If you plan to give access to a file that you have created, please make sure it is free and accessible via your blog and not through a store. I know this rule bothers some people, but the purpose of #Made4Math is not to make money.. it's to share with our friends! One of the guiding principles of the MTBoS is that by crowd-sourcing, we learn from each other and therefore end up being better teachers. :)
3) Reflect on something you already made. Maybe you had a #Made4Math from last year and you want to let us know what worked... and what didn't! Blog it and share with us!
4) Remember that you can participate without blogging at all! Take the time to share the love and post a comment on one of the submissions or tweet out your love and share the link for others to enjoy!
Ready to share your creation?
It's easy to share.. just click HERE and submit a link to your blogpost!
Let's make Year 3 the best #Made4Math year yet!!!
Subscribe to:
Posts (Atom)