Saturday, June 22, 2024

Modeling with Dog Food

Tomorrow is the end of the Summer 1 Term and I took my final this morning.   My next two classes officially start on Monday, so I'm looking forward to those.

As I mentioned in my last post, I am taking a Math class each term, so the one I just finished was on Math Problem Solving and had an emphasis in Modeling.  I'm trying to blog about some of the things I learned so I don't forget them!

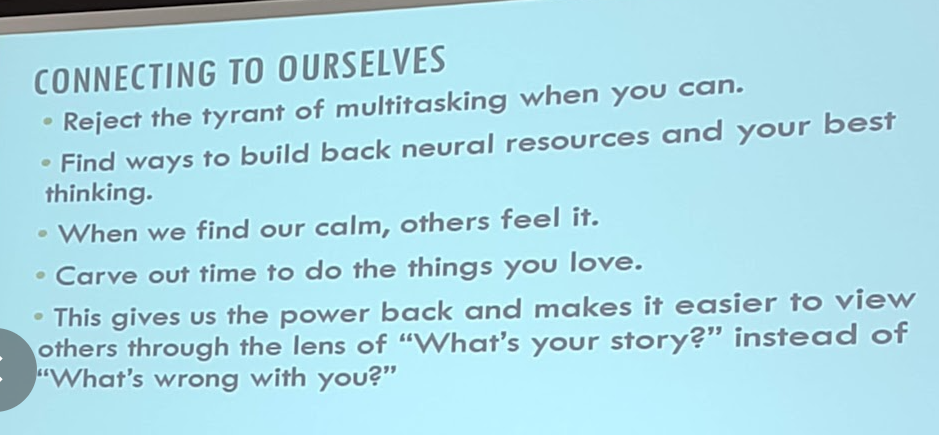
In the first week, while we were learning the difference between modeling mathematics and mathematical modeling, our written assignment consisted of a prompt with an image like this one:

Back of a Royal Canin dog food bag
Screenshot from https://www.chewy.com/royal-canin-breed-health-nutrition/dp/33917

In the assignment, some information was given about some dogs and we were asked to answer several questions using a chart like the one above.  We were also asked to write a personal perspective regarding the assignment and how we might use it in our classrooms.

When I originally had worked through the assignment, I guess-timated how much a dog that wasn't on the chart might eat based on the provided information.  However, as I started to reflect on how I might use this in my classroom, I wondered if I could use regression analysis to determine a mathematical relationship between the weight of the dog and the amount being suggested and use that to predict the feeding amount for a dog not on the chart instead of using a rough estimate.  

I put in the weight of the dog in pounds for the x-variable and the cups of dry food for the y-variable and did 3 different table of values, one for each activity level.  Check out those lovely linear patterns...


One of the things I really enjoyed about this class was the idea of using mathematics to model the world around us.  I don't have any dogs, so I would have never known a chart like this existed, but it is now tucked into my regression unit for statistics.

If you have any gems like this one that you are willing to share, please let me know!

Friday, June 21, 2024

New (to me) Tools for Graphing Categorical Data


As I mentioned in my last post, I am working on my master's degree in Curriculum & Instruction with an emphasis in Math Education.  My program has 7-week courses and I will be taking a math class each term, for a total of 18 hours of math and 15 hours of education courses.  

This week marks the end of the first Summer term with my next set of classes starting on Monday.  I am taking two classes per Summer term and will try two classes in the Fall terms as well, but not sure how that will work with teaching full time!  

I took my first math class in the spring, but it wasn't until I was halfway through the first summer term that I realized I needed a way to keep track of the ideas that I wanted to implement each week, so I created a short form to put in each of my math binders to help me remember those great ideas and where to find them!  Hopefully it will also help me remember what I want to blog about from each class!

My math class this term was called Math Problem Solving, and there was a large emphasis on mathematical modeling.  To be honest, I have very minimal experience with modeling, so most of our first week really focused on the difference in mathematical modeling vs. modeling mathematics.  Throughout the course, I definitely found connections to things I had learned from years of being involved with the #MTBoS, but I also learned a lot of new things as well!

One of those new learnings came during Week 2 of the course.  The reading assignment for the week dealt with several technology tools that could be used to model mathematics, including the tool on the left, called an Eikosogram.  

Click here to access the Eikosogram tool.

An eikosogram is very similar to a segmented bar chart or mosaic chart, both of which we use in statistics courses to graph and compare distributions of categorical data.  In the graph at the left, you can see the width of the bars are proportional to the size of the subgroup, then split proportionally within each bar to show the responses to the question - in this case about preferred superpower.

One of our class assignments required us to put together a dataset with some questions for our classmates to answer.

At the right, you can see the Eikosogram generator.  To create my dataset, I used data from the Census at School site.  After downloading my spreadsheet from the CaS, I did have to do some cleanup because the Eikosogram will throw an error if there are any blanks in the spreadsheet.  It also limits you to variables with 5 or fewer factors, so I had to recode some of the data, like birth month to birth season, to fit those parameters.  After that, I uploaded my CSV file to the website and started playing with the data.  For my class assignment, I asked the following questions:

  1. What proportion of the sample had birthdays in the Fall?
  2. Of those people born in the Winter, what proportion felt a lot of pressure regarding schoolwork?
  3. For summer birthdays, what was the most common response with regard to school pressure?
  4. Does birth month appear to be independent of schoolwork pressure?  Explain how you know.

The last question is the one where I think the Eikosogram really shines as a statistical tool.  If you notice on the screenshot, there's a checkbox to "Show Independence".  When you click that button, the Eikosogram will change to show what the graph would look like *IF* the variables were independent.  

The idea of independence of categorical variables is one that my students have struggled with in the past, so I think checking this box, then doing a "Notice and Wonder" protocol would be a great way for them to visually understand what it would look like if the variables were independent.  After that class discussion, you could follow up by clicking that checkbox off to go back to the original graph shown above to ask students if they think the variables are independent and why or why not.  

Another tool that was shared in the reading was a Pachinkogram, which is a visual tree diagram / conditional probability tool.

We did not use this tool in the class, but it's definitely a tool I want to explore for my stat class.  I love that you can move the sliders on the tree diagram to change the probabilities, then when you click Sample Once, little dots start falling and filling up the bins at the bottom! 


If you have used either of these tools in your classes or if you have other great tools to share, please let me know!  

Thursday, June 20, 2024

Life Update - A New Adventure

What a year this has been!  When I last posted, I was reflecting on the NCTM Annual Conference that was held in October in Washington, D.C.  What an amazing trip that was and I still have some sessions I did not get a chance to blog about, but then the holidays came... and winter came... and ... and ... and ...

One of those "ands" came this winter when I decided to apply to grad school!  I think I'm having a mid-life crisis :)

Seriously though, I just finished Year 26 in the classroom and even though I've looked at grad school several times, it was just never the right time, the right fit, the right (fill in the blank).  But this time, I decided to go for it!  One of the universities in my state has an online Master's program with 7-week classes that fit my budget and my available time, so within a few days of applying for the program, I had been accepted and on my way to a degree in Curriculum & Instruction - Math Education.

Oh my - what did I get myself into???

So much of who I am as a teacher is thanks to the #MTBoS, so it has been very validating to tie in my coursework with all of the things I have learned from so many amazing people around the globe.  

I'm currently finishing up my 2nd term in the program.  When school starts back in August, I will have 5 classes done, with a scheduled completion date of Spring 2025.  It's truly been a great experience so far, even though writing my first research paper *in this century* was slightly terrifying!

Wish me luck!

Sunday, November 12, 2023

Creating a Connected Math Classroom - an NCTM Reflection

 In October, I had the opportunity to visit Washington, DC to attend the NCTM annual conference.  I'm blogging through some of the sessions I attended to help me process and reflect.

On Friday, I was excited to attend Rebecka Peterson's session.  I've known Rebecka for many years and I've had the chance to hear her speak before, but I think her NCTM talk was the best one I've heard yet!  Rebecka is a math teacher in my town and a dear friend... she also happens to be our National Teacher of the Year!  Rebecka's talk was on Creating a Connected Math Classroom and it fit so perfectly with Tim Kanold's session Teaching with Heart and Soul!  

Rebecka started her talk with a quote that always makes me think of her - "Every day may not be good, but there's something good in every day."  (You can click here to read her daily classroom reflections on the One Good Thing blog.)  One of the things she mentioned that stuck was that the more time we take to notice the good, the more good we will notice.  This reminded me of the cognitive idea of "frequency bias", where once  you start looking for something, you see it everywhere.  

The big theme of Rebecka's talk was Connections.... Connecting to our students, to parents / guardians, to the community, to ourselves, and to others.  

With students, she looks for ways to get to know their stories.  A few years ago, Rebecka started scheduling individual time for students to come in and introduce themselves to her and tell their stories.  I admire her so much for this as that idea of scheduling 150 individual blocks seems so very daunting, but also so very powerful.

She also mentioned parent connections through daily emails home as part of her "daily good things".  I have done this in the past as well and it is super powerful.  I got away from it a bit over the past few years, but I need to get back to it.  In HS, parents don't always hear about the good stuff going on with their kiddos, so it's a great thing to be able to share that good news with them!

She also mentioned the impact of building community in your classroom - of students knowing how much they are loved and cared for.  Little things like recognizing a birthday or the end-of-year traditions can really help to build that culture of caring.

Some of these ideas I've borrowed from her over the years, such as the holiday ornament, but others I'm definitely stealing moving forward!  I love the idea of playing soft instrumental music and the thumbprint canvas - I really wish I had started that idea as a new teacher!  Another idea I want to steal... I've had parents ask me to sign a copy of the book "Oh, the Places You'll Go" at the end of the year, but I never thought about turning that around and having my OWN yearly copy for each student to sign!  What a brilliant idea!  (Are there any other book suggestions for this?)

She also talked about connecting students to themselves... having them reflect with things like their own One Good Thing journal or weekly exit tickets.  I used to be really good with those, but time and energy gets away from us... I need to get back to it!

One of the ideas I loved was her daily menu of activities, including the Tuesday Tips like sharing an easy cookie recipe or adulting tips like the gas tank arrow on your car.  

Rebecka also mentioned how important it was for us to connect to ourselves, which reminded me a LOT of Tim Kanold's Quadrant II time.  

One question she asked us was "What matters to you?", then ask ourselves how we can incorporate that into our weekly routine.  

This was definitely one of my favorite sessions of NCTM because it gave so many practical and doable suggestions for how to build community in your classroom.


Saturday, November 11, 2023

Using Manipulatives in Geometry - an NCTM Reflection

In October, I had the opportunity to visit Washington, DC to attend the NCTM annual conference.  I'm blogging through some of the sessions I attended to help me process and reflect.

One of my favorite sessions from the conference (and one of the few sessions where we actually DID math) was on Using Manipulatives in Geometry and was presented by Erin Schneider of CPM.  I have long been a fan of the CPM curriculum and I wish it was available in my state!

One of the first activities we did was using an 8 foot length of yarn that had been tied into a large loop.  Erin asked us to work with our team to use the yard to create the solids shown in the picture.  This was a great team-building exercise and a great activity for post-lunch time on the first full day as it got us out of our seats, talking / communicating with other people, and using spatial reasoning.  I jotted in my notes that this would be a fabulous first day of school activity (or first day of the SA/V unit) for my Honors Geometry kids, so please hold me accountable on this one!

From there, she moved to talking about a Kaleidoscope and its use in Geometry.  I remember LOVING my Kaleidoscope as a kid, but never thought about how I could use it in my classroom!  She started with a video for us to notice/wonder, then we used hinged mirrors to create our own to explore polygons.  (You can see her image at the bottom left of the collage.  When I got home, I immediately searched Amazon for cheap mirrors that I could use.  I found some plastic ones and when they arrived, I taped them together and started playing!  Every student that has noticed the hinged mirror has been fascinated with it!

In the workshop, she was using it to explore polygons and central angles, but it could also be used to explore rotational / reflectional symmetry as well as building the Area Formula for Regular Polygons.  

We were already running out of time, so she shared some quick ideas on various topics before moving on to using a pantograph for dilations.

You can use 2 identical rubber bands and tie them together as seen at the upper right here.  Draw a small pre-image (seen here as a small heart at the corner of the paper, then set the point of dilation (here, it was off the paper) with the knot of the rubber bands on top of the drawing.  With your pen on the paper, use the knot to trace the pre-image and your pen will be tracing the enlarged image.  Sadly, I've already done dilations in general, but this could be a fun way to introduce similar polygons, so I'm excited to try it!

As I said above, this was definitely one of my favorite sessions of the entire conference and I was able to walk away with ideas that I could easily implement, so I consider that a huge win!


Sunday, November 5, 2023

Teaching Math with Heart and Soul - an NCTM Reflection

Last week, I had the opportunity to visit Washington, DC to attend the NCTM annual conference.  I'm going to blog through some of the sessions I attended to help me process and reflect.

My first session at NCTM was the perfect start to the conference!  I had heard of Dr. Timothy Kanold multiple times and had read some of his work on PLCs, but this session focused mostly on his books Heart! and Soul!.  It also touched a bit on his book about Educator Wellness and all three books quickly went on my TBR list!  I have started reading Heart!, so I'm sure I'll be updating this with take-aways from that book as well.  (Anyone want to #eduread it with me?)

Dr. Kanold started his session talking about the importance of gratitude and shared about his family tradition of asking "What was the best part of today?" around the dinner table.  He asked us to send a text of gratitude to someone who made it possible for us to be at NCTM.  While he was talking about this, I thought of Rebecka Peterson, our National Teacher of the Year, and how she credits the One Good Thing blog for being such an instrumental part of her teaching journey.  Funny enough, Rebecka walked into the session a few minutes later, so obviously Dr. Kanold's session blurb resonated with her as well!

Here are some of my jotted notes from Dr. Kanold's session:

  • Can we fully give ourselves to our work and not get lost?  (Answer - Yes, but you do have to take care of yourself!)
  • Presenting ourselves in a high positive happiness state affects how well students learn in our classes
  • How can we embrace joy amidst the daily chaos?
  • Joyful people are hope providers
  • Compassion - caring / support / love... emotionally mourn the setbacks of others and cheer on their victories
  • What evidence can you show that your school has a compassionate culture?
  • Acts of compassion helps us sustain.
  • What acts of compassion would we see at your school?  
  • An antidote to burnout is self-compassion
  • Residue of self-compassion is joy
  • There is power in journaling over verbal processing... journaling dissipates the emotion
Then Dr. Kanold shared with us about the Energy States.  (The math teacher in me doesn't like how the quadrants are numbered, but anyway....)

In the classroom, we would like to be in Quadrant 1, but there is a natural drive to Quadrant 3.  He said that "Internal Balance is the key to well-being"

How do we achieve that internal balance?

KEY - Q2 time time is required daily!! 

Some more jottings about this idea:
  • Be intentional about time for solitude (referenced Sherry Turkle - purposeful solitude with an embraced silence)
  • Give your brain time to be quiet
  • Daily quietude required
(Side note - I LOVED this idea.... I need that quiet time, not just as an introvert, but now I know it helps me stay more balanced!)

Dr. Kanold ended his session with some tips on self care and the Wellness Framework, which had some really great tips, including Drink the Stupid Water.  I am the world's worst about drinking water, but I am making an renewed effort after his session.  

He also talked about the importance of movement and not comparing yourself to others because if you are moving, it counts.  His last tip was about the importance of sleep and gave us some suggestions on how to get the best rest.

My biggest take-aways:
  • Quiet time is required to keep us in a positive frame of mind.  Go for that walk, sit outside, read the book, meditate, whatever it is that gives you time to find peace every day.
  • Drink the Stupid Water - hydration is so important and if you get thirsty, it's already too late and your body is dehydrated.  Start your day with a bottle of water beside your bed.
  • You are harder on yourself than you should be and we are not as kind to ourselves as we are to others.  Give yourself grace
  • Find moments of joy and gratitude in every day


Monday, October 30, 2023

May I have a Library Card? (NCTM Day 2)

After a busy first day in DC and a fairly decent night of sleep, we woke up on Tuesday for another day of sightseeing, but what a day it ended up being!

Knowing how much I love to read, Cindy suggested we check out the Library of Congress.  Since I'm always happier when I'm surrounded by books, I quickly agreed and to be honest, this has to be one of the most beautiful buildings I've ever explored!

When we arrived, we found out that entrance was by ticket only, so Cindy quickly signed us up and we waited for about 15 minutes before getting in line.   

Once we were inside, I was just awe-struck by how gorgeous it was.  

While at the Library of Congress, we saw the Gutenberg Bible, walked through the Visitor Overlook over the Main Reading Room, and saw a few other exhibits, including Thomas Jefferson's personal library...

I thought this would be a pretty quick trip overall and we had plans to go to the National Air and Space Museum that afternoon, but our plans were definitely changed!

While we were in the Overlook, we noticed a sign that said "Anyone 16 and older can apply for a reader's card to use the Library's general collections here."  Are you kidding me??? I can have a library card for the LIBRARY OF CONGRESS?!?!?  Sign me up!!!

Once again, I was completed enthralled with the floors... I could do an entire geometry unit just on the floors of the Library of Congress!

Anyway, while I'm wandering around taking photos of the floors, we find some docents and ask them about obtaining a library card.  It took a while to get clear(ish) directions, but finally we were off to the basement to get a library card!

After we got our cards, we were standing at the entrance to the Main Reading Room, wondering what we could do with our newfound treasure, so we asked the security guard where the Math books would be located.  JUST as we asked him, one of the research librarians was walking by and stopped because she heard us mention "math".  Turns out, she was a former HS Math Teacher and she asked us if we would like to see her research... Umm YES!

Y'all - we got a BEHIND THE SCENES tour of the Library of Congress!  She took us to her office to show us some of her research, then took us down the stacks to see the LoC collection of math books!  

*Pinch me now*

Eventually she took us to the floor of the Main Reading Room (again, having an urge to watch the National Treasure movies when I saw the doorway in the central desk!)

I was totally in book heaven.... I could have easily stayed there for days and it will be a memory I will forever treasure and definitely the highlight of my DC trip!