Showing posts with label statistics. Show all posts

Saturday, June 22, 2024

Modeling with Dog Food

Tomorrow is the end of the Summer 1 Term and I took my final this morning.   My next two classes officially start on Monday, so I'm looking forward to those.

As I mentioned in my last post, I am taking a Math class each term, so the one I just finished was on Math Problem Solving and had an emphasis in Modeling.  I'm trying to blog about some of the things I learned so I don't forget them!

In the first week, while we were learning the difference between modeling mathematics and mathematical modeling, our written assignment consisted of a prompt with an image like this one:

Back of a Royal Canin dog food bag
Screenshot from https://www.chewy.com/royal-canin-breed-health-nutrition/dp/33917

In the assignment, some information was given about some dogs and we were asked to answer several questions using a chart like the one above.  We were also asked to write a personal perspective regarding the assignment and how we might use it in our classrooms.

When I originally had worked through the assignment, I guess-timated how much a dog that wasn't on the chart might eat based on the provided information.  However, as I started to reflect on how I might use this in my classroom, I wondered if I could use regression analysis to determine a mathematical relationship between the weight of the dog and the amount being suggested and use that to predict the feeding amount for a dog not on the chart instead of using a rough estimate.  

I put in the weight of the dog in pounds for the x-variable and the cups of dry food for the y-variable and did 3 different table of values, one for each activity level.  Check out those lovely linear patterns...


One of the things I really enjoyed about this class was the idea of using mathematics to model the world around us.  I don't have any dogs, so I would have never known a chart like this existed, but it is now tucked into my regression unit for statistics.

If you have any gems like this one that you are willing to share, please let me know!

Friday, June 21, 2024

New (to me) Tools for Graphing Categorical Data


As I mentioned in my last post, I am working on my master's degree in Curriculum & Instruction with an emphasis in Math Education.  My program has 7-week courses and I will be taking a math class each term, for a total of 18 hours of math and 15 hours of education courses.  

This week marks the end of the first Summer term with my next set of classes starting on Monday.  I am taking two classes per Summer term and will try two classes in the Fall terms as well, but not sure how that will work with teaching full time!  

I took my first math class in the spring, but it wasn't until I was halfway through the first summer term that I realized I needed a way to keep track of the ideas that I wanted to implement each week, so I created a short form to put in each of my math binders to help me remember those great ideas and where to find them!  Hopefully it will also help me remember what I want to blog about from each class!

My math class this term was called Math Problem Solving, and there was a large emphasis on mathematical modeling.  To be honest, I have very minimal experience with modeling, so most of our first week really focused on the difference in mathematical modeling vs. modeling mathematics.  Throughout the course, I definitely found connections to things I had learned from years of being involved with the #MTBoS, but I also learned a lot of new things as well!

One of those new learnings came during Week 2 of the course.  The reading assignment for the week dealt with several technology tools that could be used to model mathematics, including the tool on the left, called an Eikosogram.  

Click here to access the Eikosogram tool.

An eikosogram is very similar to a segmented bar chart or mosaic chart, both of which we use in statistics courses to graph and compare distributions of categorical data.  In the graph at the left, you can see the width of the bars are proportional to the size of the subgroup, then split proportionally within each bar to show the responses to the question - in this case about preferred superpower.

One of our class assignments required us to put together a dataset with some questions for our classmates to answer.

At the right, you can see the Eikosogram generator.  To create my dataset, I used data from the Census at School site.  After downloading my spreadsheet from the CaS, I did have to do some cleanup because the Eikosogram will throw an error if there are any blanks in the spreadsheet.  It also limits you to variables with 5 or fewer factors, so I had to recode some of the data, like birth month to birth season, to fit those parameters.  After that, I uploaded my CSV file to the website and started playing with the data.  For my class assignment, I asked the following questions:

  1. What proportion of the sample had birthdays in the Fall?
  2. Of those people born in the Winter, what proportion felt a lot of pressure regarding schoolwork?
  3. For summer birthdays, what was the most common response with regard to school pressure?
  4. Does birth month appear to be independent of schoolwork pressure?  Explain how you know.

The last question is the one where I think the Eikosogram really shines as a statistical tool.  If you notice on the screenshot, there's a checkbox to "Show Independence".  When you click that button, the Eikosogram will change to show what the graph would look like *IF* the variables were independent.  

The idea of independence of categorical variables is one that my students have struggled with in the past, so I think checking this box, then doing a "Notice and Wonder" protocol would be a great way for them to visually understand what it would look like if the variables were independent.  After that class discussion, you could follow up by clicking that checkbox off to go back to the original graph shown above to ask students if they think the variables are independent and why or why not.  

Another tool that was shared in the reading was a Pachinkogram, which is a visual tree diagram / conditional probability tool.

We did not use this tool in the class, but it's definitely a tool I want to explore for my stat class.  I love that you can move the sliders on the tree diagram to change the probabilities, then when you click Sample Once, little dots start falling and filling up the bins at the bottom! 


If you have used either of these tools in your classes or if you have other great tools to share, please let me know!  

Monday, July 29, 2019

#Made4Math - Preparing for a New Year

Monday is here, again???  How does that keep happening???

Seriously though, the past few weeks have *flown* by and this week will be no exception.  Between hosting the Northeast Oklahoma Math Teacher Gathering, attending another workshop at school, organizing #MTBoSBlaugust, and celebrating several birthdays / anniversaries this week, it's gearing up to be a very busy end of July / start of August!  While I technically have a couple of weeks until I officially report to school, summer is pretty much over and I have so much left to be done!

But at least I had a few bursts of productivity to share with you :)


Made4Math #1 - Big Protractor
When I first started teaching, instructional technology pretty much consisted of using transparencies and an overhead projector.  Now that we've moved past all of that, some of us (ahem) still have piles of transparencies that we stockpiled way back when. :)

For years, I have made small protractors for students to put into their notebook, but that hasn't dwindled my stock much at all.  Last year, I noticed that I kept grabbing a small protractor to illustrate on the Promethean when talking about measuring angles but for whatever reason, I never thought to make a large protractor!  So, this summer, that was one of my projects.  I just took the student image, enlarged it to fit an entire page, and printed it.  I can use it on the Promethean or on the whiteboard!  yay! :)  Here'a copy of the big protractor for you to use if you want it! :)


Made4Math #2 - Domino Puzzle
Based on recommendations from the #MTBoS, I started a Puzzle Table a few years ago and the response from my students has been amazing.  I put out a new puzzle each Monday and the kids work on it all week.  However, I will have some kids this year that I had last year, so I needed some new puzzles for the upcoming year.  Of course, the amazing Sarah (@mathequalslove) to the rescue!  (Note - if you've not read Sarah's blog - go there now - I'll wait!)  Anyway, a few weeks ago, she posted a link to the ATM Puzzle Page and while browsing, I found this great domino puzzle that I knew would be perfect for the Puzzle Table!  In the picture at the left, you can see the domino pieces plus a puzzle that Sarah shared on her blog this summer.  I organize the puzzles in a Puzzle Binder with the instructions and puzzle pieces in a sheet protector, then a divider at the back to keep separated the puzzles I've used vs those I haven't used yet that year.


Made4Math #3 - Stand and Talk
One of the best blog posts I read this summer was a post by Amy Zimmerman sharing the love for Stand and Talks.  I had previously read the original post by Sarah VanDerWerf, but Amy's post let me down the rabbit hole of research and finally to an amazing episode of Global Math Department led by Sara VanDerWerf on Stand and Talks.  Since then, I've been thinking through how I could use them in my classroom.

With AP Stat, there were some curriculum revisions this summer with the new CED, including a graph that I had never heard of - a mosiac plot.  Doing some more research led me to this link, where I found the above graphs regarding the survival status of those on the Titanic.  You can download the Stand and Talk here.


Made4Math #4 - AP Formula Sheet
In May, when the new AP Stat Course and Exam Description (CED) was released, one of the changes was the Formula Sheet.  The previous formula sheet had been around since the course started in 1996-1997 and was due for an update.  As soon as the CED was available electronically, the formula sheet was the first section I checked out and needless to say, I was a bit bummed.  The tables (Z, T, and Chi Square) were not user friendly and spanned multiple pages, which made printing them for the classroom a bit tricky.  This past week, I finally had made time to reformat them, mainly because I need to start sending stuff to the Copy Shop! :)  I formated the tables so that they will easily fit a composition notebook and still be readable.  If you would like the revised tables, feel free to grab them here!


I have a few more projects in the works, but I didn't get them done in time to share them this week, but that's okay - it gives me something to write about next time! :)  But until then, have a great week and Happy Back to School! :)

Wednesday, August 29, 2018

Evolutions in Teaching


This month, I'm participating in a blog challenge called Blaugust.  To see the list of participating blogs, click on the logo above. I would encourage to you please cheer on our participants with either a tweet or a comment on their blog during this month. It can be hard to blog on a daily (or even regular) schedule! :)  If you would like to join the blogging challenge, you can still sign-up anytime!


August is almost over and yet again, I have not made my Blaugust goal - BUT - ultimately, the point of Blaugust is to get me back into the habit of sharing about my classroom and I *have* achieved that, so go me!  Thank you ALL for reading, responding, sharing, and commenting on my posts and the other Blaugust participants.  It's such a great resource of ideas and inspirations for back to school and I appreciate you!.

I've now been back to school for 2.5 weeks and I'm making good progress on my goals!  I have so many blog posts floating in my head, but by the time I get home and get things ready for the next day, I'm utterly exhausted!

But tonight I want to reflect on one of my goals and how things have evolved in my classroom over the past few years. :)


Multiple Choice Mondays - Version 1
Each Monday, my AP students do a MC Monday consisting of 5 questions over material we've learned (or previous content, like ACT style questions).

However, I didn't want them just to do the MC questions and be done - I wanted my students to reflect on their learning.  This is a common theme in my classroom and I often ask students to write / reflect / summarize to help them solidify the material.  So on Mondays they do their MC and put it back into their table folder.  The next day, the reflection part on the back is their warmup.  For the first 1 (or maybe 2... I don't remember), this was the back of the MC Monday.  The Analysis at the top had a place for the correct answers, whether they got it right or wrong, the type of error, and whether they needed to study that concept.  The bottom was a reflection grid (inspired by the assessment grid that @pamjwilson has blogged about before), with various prompts.  Overall, I liked this, but kids would often write the same thing week to week and weren't really using the grid the way I had envisioned it, so back to the drawing board...


Multiple Choice Mondays - Version 2
So the following year (Year 3 I think?), I changed it...  I had discussed some of my frustrations with the grid with my neighbor teacher and she was having some of the same issues.  Both of us really liked having a place to ask questions and have a dialogue with our students, but decided that maybe we needed to be a bit more specific with the other prompts.

As a result, Version 2 was born, with the prompts asking about which questions they felt most confident about (and why), and least confident about (and why).  We tried to impress on the students that most / least confident is NOT about getting the answer right, it's about how you felt regarding the material.  However, that was an uphill battle as even at the end of the year, I was still having to make the speech about "Remember - confidence is NOT about the answer - it's about the question!"  I did have some great comments and questions from my students on the "I have the following questions..." prompt, but I was disappointed in the most / least confident prompts, so back to the drawing board - AGAIN...


Multiple Choice Mondays - Version 3
I'm really hoping that the third time really is a charm...

During the teacher work-days, I *still* hadn't figured out how I wanted to change the MC Monday Reflections, but I knew that it needed to happen.  I popped by neighbor teacher's room to see if she had any brainstorms and she was as stuck as I am.  Both of us wanted to keep an area for students to ask questions, but that was about all we knew.  I mentioned to neighbor teacher that I really wanted to incorporate more vocab review into the class with "Terms Tuesday / Words Wednesday" and wondered about using the MC Monday to help drive that.  Thankfully, she loved the idea and our latest version was born.  The Analysis box got simplified a bit with the last columns being combined into a spot for students to write themselves notes, then the general reflection area that combines multiple prompts into one, and finally the Terms Tuesday / Words Wednesday box.

So this week was our first MC Monday and I *LOVED* it!  It was so much fun to do the vocab and I think they really enjoyed practicing their retrieval skills to see if they could recall the words we had learned so far.  I'm super excited to see how this plays out over the year, but we might have a winner - plus, it helps me meet my vocabulary goal!  YAY!


If you have suggestions on how to improve this further, please let me know :)

Monday, August 6, 2018

How Things Change...


This month, I'm participating in a blog challenge called Blaugust.  To see the list of participating blogs, click on the logo above. I would encourage to you please cheer on our participants with either a tweet or a comment on their blog during this month. It can be hard to blog on a daily (or even regular) schedule! :)  If you would like to join the blogging challenge, you can still sign-up anytime!


I've been working the past few days on a PD session that I am giving tomorrow to our district's new teachers on Formative Assessment and I finally have it done and handouts printed... which of course means that I will find 20 new ideas between now and midnight that I should have used instead :)

While I was working this morning, I was also involved in a Twitter discussion with @katherine_ruse about various activities for our AP Stat classes and it made me think about how things in my classroom have changed over the years.

One example that immediately came to mind is an activity I blogged about in 2014 - using Quiz Quiz Trade for Sampling Methods:
The original file was meant to be printed 2-sided and used as a flashcard style activity where students would be roaming about the classroom and "quizzing" each other.

But once I used it, I wasn't crazy about it, so Iteration #2 was a Card Sort...
The card sort used the same cards as QQT, but did not have the answers on the back.  Groups were given a mat of sampling methods and they were to read each card and sort the problem based on the method.  Overall, I liked this better and I have used this the past couple of years, but I did have two frustrations... 1) It was hard for me to gauge student understanding in the moment and 2) every student reads and processes at slightly different speeds, so some kids were zooming along and leaving others in the dust...

So this year, to try to fix the issues with the Card Sort, I'm going to try Hold Ups...
Hold Ups is an idea that I learned about from Total Participation Techniques by Himmele and Himmele.  I have used them in Geometry quite a bit, but for Iteration #3 of the Sampling Methods activity, each group will get a set of 7 cards with the 7 sampling methods listed.  As a class, I will present a problem and give think time.  Then as a group, they will discuss which method they think it is and on my cue, they will hold up the card they think it might be - AND - be prepared to defend their answer.

I'm hopeful that Iteration #3 will be *the one* but if not, that's okay, there's always more learning and growing to be done! :)


Friday, August 3, 2018

#GradeSmarter - Unit Plans


This month, I'm participating in a blog challenge called Blaugust.  To see the list of participating blogs, click on the logo above. I would encourage to you please cheer on our participants with either a tweet or a comment on their blog during this month. It can be hard to blog on a daily (or even regular) schedule! :)  If you would like to join the blogging challenge, you can still sign-up anytime!


Happy Friday and welcome to Day 3 of Blaugust!

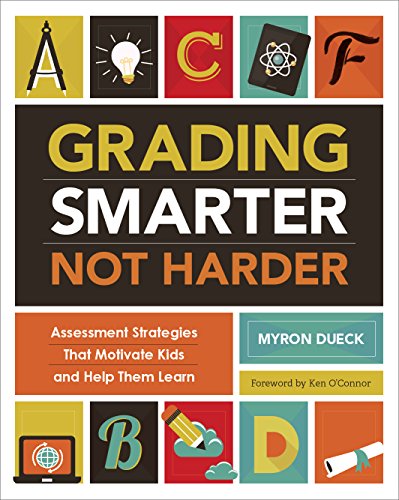
I've already written a couple of posts based on this book, specifically geared toward homework, but Ch 3 was another one that hit me pretty hard.

In the introductory paragraph of Ch 3 comes this gem:
"Maybe it's just human nature - we crave some element of predictability and find comfort in knowing a little about the future."

As I pondered this quote, I realized how true it is.  I *hate* surprises and I like having a plan in place, so why shouldn't kids be the same?  I have kids that are very busy - jobs, athletics, multiple AP classes, etc, so why shouldn't I do all that I can do to help them know where we are going so they can maximize their schedule?

Years ago, I provided my students a monthly calendar that listed everything - lessons, homework, assessments, etc.  Over the years, I got away from that and started posting the weekly calendar in the classroom as well as on Canvas, our Learning Management System, but in general, kids still seemed shocked when assessment time came around... "Wait - what??? We have a Quiz today??" 

So this chapter on Unit Plans seemed like perfect timing.  We are switching to new books and as a result, I have spent part of my summer looking at the various structures I had in place and how to make them better and one that I definitely wanted to work on was the Chapter Info Sheet.

Here's the old info sheet:


The info sheet was the chapter divider for each chapter and it listed the learning targets, the vocabulary, and was supposed to act as a reading guide for the chapter.  Except that my students really didn't read the book that much and I can't really blame them - even though our textbook was extremely readable, there wasn't much of a need to read given our in-class activities and the INB.  As a result, this info sheet ended up as something we put in every chapter, but it wasn't really used to help move learning forward.

And then I read "Grading Smarter"...

I already knew I wanted to change the Info Sheet, but now I wanted it to be useful, I wanted it to have a roadmap of where we were going.  So, here's the result:

The new info sheet template:


This new info sheet will have the daily calendar on the front, which is somewhat tentative, but I try to stick pretty close to my pacing guide.  Assessment dates will be provided as will daily assignments. That way, if a student is absent, they know where to find out what we did and hopefully if they are going to be absent on an assessment, can make plans to take care of that early!  On the inside will be the learning targets for each section and a vocabulary rating chart.  One thing I think I will like is that this info sheet will literally be a guide to us throughout the chapter.  As we finish a section, they will flip here to do their self-assessment of the learning targets, a quick reflection question (like maybe 3 new things you learned, etc), and a vocab rating.  At the end of the chapter, we will do the same thing with the Chapter Summary on the front (like a 3-2-1 or some other summarization strategy).

I'm really excited that I finally have this template in place because it's been bugging me for weeks that I wanted something else but just didn't know what to do!

So what do you think?  Poke holes in my plan... Can you break it and help me make it better?


Tuesday, June 19, 2018

Raw Emotions

I'm a day late for #MTBoSBlog18, but considering that yesterday was the AP Reading Travel Day and I struggled to keep my eyes open, I am still counting this :)

I am feeling raw today. I don't know how else to explain it. I just spent a week with some of my dearest AP Stat friends, reflecting on the year, thinking of new strategies to use, and learning from each other, and to be honest, it made me wonder what has happened to me over the years.

This year's AP Stat test was a "math-y" test and I really didn't know what to expect going into the Reading. I know that in general, my students are not "math-y" students and over the years, I have de-emphasized a lot of the computations in favor of more conceptual understandings and this year that might come back to bite me. And then I started thinking back over the years...

Eighteen years ago, in the summer of 2000, I received a phone call the week before school started asking me if I would be willing to teach AP Stat. I had taught for 2 years, but nothing higher than Geometry and while I had taken a couple of stat classes in college, I wasn't sure about teaching the class. What a whirlwind of emotions I had that year! The AP Stat program was in its infancy and there was only one textbook out there at the time. I was clueless and lost. I stumbled my way through the year, many nights falling asleep with the textbook on my lap and gave "free days" more often than I'd like to admit because I did not know the material well enough to teach it. I diligently took notes on a legal pad, then transcribed them each day on an overhead projector for my students. I remember attending a 2 day training in early November 2000 and one of the sessions was on Type I/II Errors & Power and cried most of the way through the session because I was so lost. I was overwhelmed, exhausted, and had no idea what I was doing.

Somehow I made it through the year and even had some kids pass the exam! I spent the summer diving into every resource I could find, scouring used book stores for Statistics books, printing off idea after idea from the internet, and determined that year 2 would be better.

And it was. I fell in love with the course and attended every workshop I could find in order to deepen my own knowledge of the material.

Over the next few years, I focused more and more on having a student-centered classroom. I believed in the "sticky-ness" of activities, I used online applications to integrate technology, and the program continued to grow and thrive.

But this week, as I listened to the amazing teachers around me, I realized how much I had changed. I don't know exactly when this change occurred, but it did. I realized that while I still believe in the student-centered classroom, I don't know that my daily classroom practice illustrates that belief. I have regressed back to more lecture and more handouts and less activities. It's easy to find reasons excuses why this change has happened - larger class sizes, larger program, new preps, student changes - but ultimately, the responsibility lands on my shoulders. I allowed it to happen.

This realization about how much I have changed really bothers me. I was the young whipper-snapper, eager to change the world. I was the one that ran several teacher resource websites to share teaching ideas with the community. I was the progressive, student-centered, engaging teacher. But today, I just feel old and tired.

I'm not quite sure (yet) how to deal with this. I know that a good chunk of it is in my head. I know that I am a MUCH better teacher than I was at the beginning. I know that I have (way too many) resources at my fingertips. I know that I have some amazing pedagogical tools in my teacher tool-belt.

This year, we are adopting new textbooks. This change is somewhat scary because I have used my current textbook / author for at least 14 years, but I'm hoping the change will be the shock to the system that I need.

I still love teaching the course, but this summer I need to focus on how to channel that "inner me" that I know is still there.

Wednesday, February 21, 2018

The 10% Rule

What a wild and crazy week filled with PD, 80 degree temps, followed by freezing rain and frozen car doors - and it's only Wednesday!!! :)

On Monday, I had the honor and opportunity of being interviewed by my Associate Principal for his inaugural podcast on Teaching and Learning.  I have known my AP as a fellow teacher and then as an administrator for almost 20 years and I highly respect him as an educator and colleague.  During the interview, we talked about a lot of things, such as technology in the classroom, assessment strategies, and the things that have impacted my classroom over the years.

One of the questions he asked was regarding what advice I would give to teachers about how to go about making changes in their own classroom practice and this question has been knocking around in my head ever since.  

I think Steve Leinwand said it best in his Mathematics Teacher article on surviving in a sea of change:

What I love about this 10% idea is that it is manageable.  We have so many things that can overwhelm us on a monthly / weekly / daily / hourly basis, but if we focus on changing just one lesson every 2 weeks, think about how those little changes, those little shifts, will add up in the long run!

This 10% idea came back to the forefront as I planned my lessons this week.  I'm notorious for changing my lesson at the last minute, which is part of the reason why I have a commercial grade printer at my house!  I'm constantly looking for the best way to reach my students, which often results in me completely scrapping a lesson the night before I plan to teach it.  For the record, I don't recommend that you find your "10%" quite in this same manner, but that is how it seems to work in my world. :)

In AP Stat, we are starting 1 sample hypothesis tests and last Friday, we did the "Globe Lab" where we tossed around inflatable globes from Dollar Tree to test the hypothesis of 71% water on the globe's surface.  This is a great activity to expose students to the logic of hypothesis testing and how it ties in with the sampling distribution model for proportions.  After a 3 day weekend, it was time to formalize the process.  The only issue is that yesterday/today was a block day and no one needs to do 100 minutes of lecture, which means that Monday afternoon / evening, I was trying to figure out how to integrate some practice, movement, and brain breaks into the very lengthy lesson.

For all of our hypothesis tests, I teach a 6 step method (see foldable above) and my students are already familiar with how to write hypotheses and checking their conditions, but putting it all together and writing conclusions are definitely new to them.

I decided that we would take notes and practice the first three steps (name, hypotheses, conditions), then finish up the notes and practice making decisions and writing conclusions.  I adapted 4 textbook problems and printed them double sided, so that when folded in half, the problems would fit into 5x7 acrylic frames.  (See photo on left)  When we got to the part of taking the paper out of the frame, unfolding it, turning it over and refolding it for "the rest of the story", you would have thought I had totally blown their minds! :)  

Now back to the 10% rule....
I've taught hypothesis testing now for 18 years, with some years being way more successful than others.  From lecture to activities to practice problems to card sorts to error analysis - I've done it all.  But this one little change of adding in some processing time and brain breaks seems to have made a huge impact, based on the results from their daily reflection.  Hopefully that impact is still noticeable tomorrow :)

Here are the files if you are interested:
Hypothesis Test Foldable (print two sided - flip on short edge)
Hypothesis Test Practice Problems (print two sided - flip on long edge)
Practice Problems Recording Sheet (print two sided - flip on short edge)

(This should go without saying, but recently, several teachers, including me, have found some of our work put onto teacher websites for a profit.  The files I've shared above are for your personal use and not to be used for profit.  The 4 practice problems are adapted from textbook problems and are not my original work, but the foldable and recording sheet are mine.  Sorry to end this post on a downer note, but it needed to be said :) )

Saturday, October 28, 2017

#MTBoSSundayFunday - Photo of the Week

Just a reminder that the #MTBoS Sunday Funday challenge is back!  This is a weekly blogging prompt that is hosted over at Julie's blog and this week's theme is "Photo of the Week"

Every week, Julie will push out a new topic, you blog about it and submit your blog post using this Google Form.  On Sunday, there will be a huge list of awesome blogs to go read! :) YAY!


As always, this is a no pressure blogging challenge, so if you don't feel like blogging, that's okay!  I've had many weeks already where I've failed at blogging, so I'm right there with you!  However, this week is one I just couldn't pass up :)


This week's theme is is "Photo of the Week", but this was a tough one for me.  I couldn't narrow it down to just one, so instead, I took a screenshot of this week's Instagram #teach180 posts! :)  (Can I just say that I LOVE using Instagram for my #teach180 posts... it's super simple to use and it's been a great tool for me to easily look back at my progress over the year!  Plus I shared it with my students, their parents, and my admin so they could follow us virtually!)


This week was great!  Last week was our Fall Break, so coming back on Monday was bit rough, but as you can see in the photos above, there were so many good moments this week!

To go chronologically, we'll start from the bottom right :)

Bottom right:  This was Monday in AP Stat.  After a break, we needed to do some mixed review over the chapter topics.  There were 3 problems, each one in a dry erase sleeve.  Students were up on the whiteboards working through the problems... so many good discussions!

Bottom center:  Tuesday in Geometry... You'll notice the little white box in the corner - we had a really active day!  This was a block day and we had color coded notes, some dry erase sleeve practice, and then a "Question Stack" set of cards on angle relationships.  So much awesomeness!

Bottom left:  Tuesday in Forensic Science... We had just finished a lab on the Bertillion Measurement System and read a great (yet lengthy) article on Bertillion, so we followed up with some summarization strategies.  This photo shows "Give One Get One", which is one of my favorite strategies!

Top right:  Wednesday in AP Stat... We had just finished z-scores and normality and were preparing for a quiz.  However, practice problems often get dull in worksheet format, so instead we did the same problems in card format.  Groups could choose to work on the vertical whiteboards or get one of the portable boards for their table.  So many good discussions and many of them scored perfect scores on the quiz!  yay!

** There isn't a photo for Thursday because my sophomores were taking the Pre-ACT and my Stat kids took their quiz... not a photo worthy day!

Top center:  Friday in Geometry... Thanks to the MTBoS, Friday's lesson plan was super simple... Katrina Newell (@MrsNewellsMath) had already blogged an Angle Addition / Angle Bisector foldable that all I had to do was print and use!  (Thanks Katrina!).  I do love foldables and add it to some color coded notes and you have a happy teacher on your hands!

Top left:  Friday in AP Stat... We've finished our unit in Stat, so next week we will be taking Test #2.  There were 10 stations posted around the room with 2 MC questions per station.  The students went from station to station working problems, checking with me, and going to the next station.  The hour flew by and on their exit ticket, several students even asked if we could do it again. :)


I know I didn't do quite what the prompt asked me to do, but it was such a good teaching week that I wanted to share! :)  Now to work on next week's lessons... hopefully it will be just as awesome as this past week! :)

Monday, April 24, 2017

Formative Assessment & Quizster

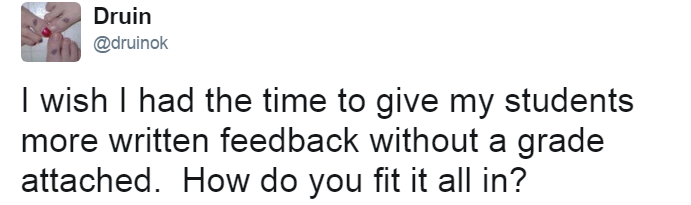
As I referenced in my Personalized PD post, I've been trying to make more of an effort to be on Twitter and connect with the amazing teachers of the Math Twitter Blog-o-Sphere (#MTBoS).  Last weekend, while grading papers, I tweeted out this question:


The question was born partly out of frustration of my limitations due to time, etc.  I believe strongly in the power of formative assessment but I quickly get overwhelmed by all of the paper that comes with exit tickets, warmup slips, etc.  I also believe in the power of feedback and I don't want my students to get their first feedback on a topic from a quiz/test, so I fight through all of those paper slips, write comments and individualized feedback on each one, and pass them back.  (Thankfully via their table folders!!)

Many people chimed in with responses to my question - Thank you #MTBoS!! - But the one that stood out to me was this tweet from Kate


Quizster is a new app by a long-time math blogger and her husband.  After checking it out and securing permission from our district director to try it out, I decided to test out Quizster with my AP Stat kiddos and a FRAPPY (aka an AP Free Response problem)

Set up was a breeze.  Quizster walks you through the set-up, plus encourages you to create a student account so that you can see what the kids see.  I tested it with both my cell phone and the webcam of my computer and it worked well with both.  Finally it was time to test it out with my kiddos!

On block day, my kids are used to starting the day with a FRAPPY, but often I have them turn it in via their table folder and hopefully they will get it back within the next few days, depending on how behind I am on grading.  With the Quizster app, the students did their work in their notebook, then snapped a photo to upload via the app's webpage on their cell phone browser / Chromebook.  (They are working on a mobile app right now).  Within minutes, I started getting notifications that I had papers to grade!


On the left, you can see my list of "to be graded" as denoted by the red circle.  When I click on a student's name, their work appears (middle photo) and I choose 'Annotate'.  On the right, you can see me writing the student feedback directly on their paper, just like I would traditionally.  After clicking the "X" at the top right, my annotations are saved and there's a button to send my feedback to the student, then back to the "to be graded" list I go! :)

Some features I really like...
  • Flexibility on grading - I can easily grade on the patio without papers flying everywhere!
  • Flexibility in the classroom - After students submitted their photos, we were able to go over the AP rubric right away as a class, yet I was still able to later give personalized feedback to each student.
  • Responsiveness - I really didn't know how easy the app would be to use or how well it would read my writing... it's extremely user friendly!
One drawback is that you do need to be connected to the internet and for students, that may mean use of their data plan if your school doesn't have accessible wifi for student devices.  I had one student that chose to use the Chromebook camera and it worked just fine, but most kids just used their cell phones.  

I'm really excited to use Quizster as we go into AP review.  So far, my students have had very positive feedback as well! :)


Saturday, April 22, 2017

Crunch Time

(Note:  I know I should probably make some sort of statement about being gone for so long, but every time I try, it just sounds awkward and weird and I erase the screen and shut down my blogging screen for another several weeks, so we're going to just skip past all that, k?  We're just going to pretend like blogging is a regular occurrence around here and that it hasn't been 7 months since I last wrote...:)  )


It's crunch time.  The AP exam is in just under 3 weeks and I'm not ready.  My kids are mostly ready, but what I wouldn't give for another week of teaching time to really solidify some concepts!  I've taught AP Stat for 17 years and one would think that I would get better and more efficient at it, but one would be wrong.  I like hands-on activities and that takes time.  With each new released AP exam, I find things that I could tweak or should emphasize more and that takes time.  Curriculum changes in the courses leading up to mine have forced intro stat/probability out the window, so filling in the gaps takes time. Classroom management of 32-33 kiddos, even when they are great kiddos, takes time.  As a result, I have to play triage and decide which topics to teach deeply, which topics to skim over to hit the high points, and which topics to move to the very end of the course and hope I get there before Exam Day comes.

This week was crazy in terms of time.  After school review sessions have started and I'm trying to figure out every little possible thing that I can do to help my students be more successful.  I love teaching seniors, but seniors after spring break can be tiring.  I'm so blessed that my students this year are a fabulous group of kids, but they are tired and I understand that completely.

Skills Check
Last week, on Pinterest, I ran across Bowman's post on Skill Drills in AP Calculus.  While AP Calc and AP Stat are both considered AP math classes, they are vastly different in terms of subject matter and needed skills, but I really liked this idea, so last Sunday, I started typing up my own version of 5 minute quick checks for AP Stat in nice little quarter-sized pieces of paper :)

I've been using them this week as exit tickets and my students have responded very well!  I don't claim ownership of these problems - in fact most of them are based on AP released exams, but you are welcome to them if you want them.

Review Flipper
Last year, I had my students make an AP Review Flipper, but this year, I just ran out of time.  The idea is that each day my students would write an index card "cliffs notes" version of a chapter of material that we could assemble into a review tool.  I got through the first 6 chapters when time just got away from me and it didn't happen this year.  I know that last year's students felt it was very useful, so I felt guilty for not getting it done this year.  With no time left and AP review about to start, I spent many hours this week transcribing my cards to send to the copy shop for each of my students.  This week, we will take a day to highlight each "card" and assemble our flippers and pray that it works okay.  I know it's not ideal - I would rather have them write the cards themselves, but.... :)


My hand was cramping for a good while after this... :)

Now I need to figure out the best way to maximize the next few weeks... In an ideal world, I could give my students some free time to work on old questions, but I've found that in general, that doesn't work well with seniors in May :)  What strategies do you use to help your students?


Monday, June 8, 2015

Chart Paper is my friend

The end of another year has come and gone, bringing with it both joy and sadness.  I love the anticipation of a new year and starting over with a blank slate, but I'm sad to say goodbye to my students and especially to wipe my classroom clean of all of the learning that has taken place in the past 180 days!  One of my goals this year was to "Make Thinking Visible", so my room was filled with posters that we referred back to often, so it was a day of sadness when I took them down and sent them out to the recycling bin.

If you know me at all, you know I LOVE school supplies (with big puffy heart loves!).  Two of my must-have school supplies are chart paper and sticky dots.  The best type of chart paper are the big post-it note pads with grid lines, but those are really expensive, so I try to be conservative with those.  We can get cheaper chart paper for just a few dollars from our district warehouse, so I tend to use that for activities like Chalk Talk, etc.  I stock up on sticky dots in the Target dollar section at back to school time.  I used to have the students draw dots, but it really annoyed me when the dots were various sizes, so now I just buy the little smiley face stickers and be done with it. :)

Anyway, a few weeks ago, I asked a group of stat teachers on Facebook about their favorite activities that they use to illustrate statistical content and I shared two of my favorites.  One of the respondents asked me to share more details, so here ya go...

Sampling Distribution of Means


I did this activity with a copy of Random Rectangles, but next year, I may use my well-loved JellyBlubbers.  For this activity, my students used a random number table to select 3 rectangles at random, find the average area and graph it.  They repeated this 3 times per person to gather a lot of data.  Then they repeated with 10 random rectangles.  The groups then discussed how the graphs were similar and how they were different.  Over the years, I had done a similar activity with proportions (flipping a coin), but the rectangles made an impact, as evidenced by one student's work below:


I don't know about you, but when an activity sticks out in a student's mind, then it's a keeper for me!

Confidence Intervals

Over the years, I have often asked my students to create a confidence interval and graph it to illustrate the meaning of "95% confidence".  However, this year, I decided to use some of my sticky dots to help nail down a few other items.  Here, students tossed a Hershey's Kiss and recorded whether it landed on its base or not.  This was our first introduction to confidence intervals, so instead of using the CI formula, students used their sample data to find the standard error and draw the sampling distribution model based on their p-hat.  Then they used +/- 2 standard errors to create their first confidence interval.  The part that I did differently this was having them graph their point estimate (p-hat) first, then draw left and right to create the interval.  The idea that I was trying to push home was that the point estimate is in the exact center of the interval, so given any interval, they can find the point estimate and the margin of error.  For some reason, this is a difficulty of many students.  They can calculate 0.4 +/- 0.12, but if you give them (0.28, 0.52), they are stuck on how to find the p-hat and the MoE.  For the rest of the semester, this graph often came up in conversation when students were trying to figure out the relationship between the point estimate, margin of error, and the interval estimate.


Now it's your turn...
How do you use chart paper in your classroom?
What are your go-to school supplies that you can't live without?
What are your favorite activities to teach/illustrate a concept?


Wednesday, November 19, 2014

NaBloPoMo - Day 19 - High Praise from a Kiddo

You know those days when you just want to take a moment at the end of the day and yell, "NAILED IT!" at the top of your lungs?

In #EduRead, we've been reading The Highly Engaged Classroom, so I've been thinking even more than usual about student engagement and how I can design lessons that incorporate movement and other engagement strategies.  Yesterday afternoon, as I was putting today's lesson together, I was trying to figure out a way to use the first 20 minutes of the block period to review for a quiz that we were having today.  In the past, I've given the students time to study on their own, but this time, I decided to do something a bit more structured.

Enter in the awesomeness that is Kate Nowak.
(Someday, when I grow up, I want to be like Kate... and Sam... and Pam... and Hedge... and Julie...and Beth.. and Elizabeth... and Glenn...  and all my other amazeball MTBoS friends!)
(P.S. I did not mean to leave anyone out... but I would totally run out of room if I listed all 400 or so of you!  Please realize that I love and cherish all of you!)

See, Kate wrote this little blog post over at her blog back in 2009 called Speed Dating.  Little did I know that 5 years later, I would be finally figuring out how to use it in my classroom!

Kids came in the room today and the desks were not arranged like they were yesterday.  It cracks me up to see how much kids freak out when the desks are moved!  Instead of 8 groups of 4 desks, there were 2 long rows of 8 pairs of desks facing each other.  Since they knew they had a quiz today, the immediate question that I answered (over and over and over again) was, "Are we having a partner quiz?!?!"  ummmm, nope!

On each desk, I had a laminated card that dealt with this chapter's material.  Mostly stuff like interpreting slope, y-intercept, r-squared, using their calculator, finding residuals, etc.  (Note, if you're an AP Stat teacher and want the file, just leave me your email in the comments and I'll get it to you!).  Last year, I used the cards to do Quiz Quiz Trade, but this year, I wanted to do something different.  I gave the students 3 minutes to work the problem on their desk, check the answer on the back, and become the "expert" on that problem.  Then they exchanged cards with their partner, worked that problem, got feedback and help from the "expert", etc.  All in all, I allowed time for them to work their original problem, plus 5 more from the partners.

During 3rd hour block, I had an even number of students, so I simply observed.  At first, I was worried that maybe it wasn't working, but no biggie, it's a learning curve.  After we were done, we rearranged the room to take the quiz, and low and behold, the kids were all done with plenty of time to spare and no grumbling afterwards!  At the end of the hour, one of my students said, "Mrs. Teacher, can we do that before every quiz?  That really helped me!"  I was happy to hear the praise, but honestly I wasn't sure how much it helped.  Then 6th hour rolled around and I only had an odd number of students, so I had to join in to be a partner.  My original card was about calculating a residual, then my other 5 problems were about interpreting slope (twice), interpreting r-squared, calculating y-intercept from the formula and interpreting it, and using my calculator to find the regression equation.  I was shocked at how many things I reviewed (and reviewed well!) in that 20 minute time span!  Again, I had kiddos praising the activity as a great way to review for the quiz.  In my 17 years of teaching, I have learned that if the kids give kudos to an activity, then it's something that I want to use again!

If you haven't tried Speed Dating, I definitely encourage you to give it a shot!  This will definitely be a keeper in my play book.

Thanks Kate!

Today I'm Thankful For:
The amazeball teachers of the MTBoS.  I'm so happy that I'm part of a community that really cares about me as a person and as a professional.  We have a little (or not so little anymore) family that really wants to help everyone become a better teacher.  There is genuine concern in helping others grow as professionals, as seen through the constant sharing of resources and lesson plans on the blogs and twitter accounts of the MTBoS members.  The best part is having a network of people around the globe that truly GET me.  I struggle to "turn off" my teacher side and it's awesome to have people around me that understand that struggle.  Thank you for opening up your classroom virtually so that I can share in your joys and frustrations.  But most importantly, thank you for being you!! :) 

Saturday, August 23, 2014

First Week Recap

Kids came back to school on Tuesday and we hit the ground running!  By the time Friday rolled around, I was exhausted!  However, this exit ticket answer really validated my efforts this week:


(This is going to be a long post.. sorry about that, but I really want a record of the activities I did this week)

My Theme for 2014-15:
Every year, I find a quote to guide me that year.  This year, my focus is on student engagement, active learning, and formative assessment.  After I find the perfect quote, I make it pretty and then put it in a photo frame next to my computer.  This year's theme:


I keep this quote next to my computer in order to have it close by when planning lessons.  I also share the quote with students so they can help keep me accountable.

Day 1:
When students walked in on Tuesday, there was a post-it pad on each table.  Instructions on the board asked students to take 6 post-its and answer the questions around the room.  I picked up the post-its at Dollar Tree.  They were packs of 4 different colors, which worked out great since I have 4 periods of AP Stat this year!


The 6 prompts said:
Qualities of a good teacher...
Qualities of a good student...
My goal for this year is...
This will be my BEST year of math because...
I learn best when...
Mrs. T can help me best by...

After completing the post-it activity, students created their nametag, which helps me learn names, get to know something about them, and provides a way to do exit tickets for the first week.  Our main activity of the day was the Kristen Gilbert story, which is a great way to get kids excited about statistics.  By the end of the day, my feet were killing me, but what a great first day!

Day 2/3:
Our school is on a modified block schedule.  On Monday, Tuesday, and Friday, we see all 6 classes for roughly 55 minute periods.  On Wednesday and Thursday, we see 3 of our classes each day for 100 minute classes and our Advisory class. 

When students walked in, they had to locate their nametag from the day before.  Each day, I randomly place them around the room so they can meet new people.  I teach in a very large district and this is a way that I can make sure that students get to know the other people in our class.  Overall, I believe it aids in classroom community, even though it makes it very challenging for me to learn names! :)

We spent the first 45 minutes or so setting up our notebooks.  During this time, we also talked briefly about the syllabus, my classroom expectations, and I shared with them my theme for the year.  I told the students to hold me accountable for more student DOING and less teacher TALKING. 

Then we were off to Chapter 2.  Each chapter, I give them an "information sheet" with the essential questions, the vocabulary for that chapter, and some reading questions from the textbook.  The students numbered off in their groups 1-4, then each person was assigned a question to answer by skimming/reading the text. 


After about 5 minutes, students got out of their seats and went to an assigned corner to talk to the other students with the same assigned question.  This allowed the students to feel more confident that they had the "right" answer before going back to their original groups to be the "expert" on that question.  This was a great way to incorporate the textbook without being overwhelming and it provided students a way to get up and move/talk with peers, thereby restarting their brains for learning.

Back in their home groups, they shared out the answers to each question, then we discussed them as a class.  We took a few clarifying notes on the "Ws" and then we were back to the students "doing" instead of me talking. 


Each group received a problem where they were asked to identify the "Ws".  The answers were on the back so the students could gauge how well they were doing, then we rotated to another problem.  The exit ticket for the day was a "6 word memoir".  To read some of their exit tickets, check them out HERE.

Day 4:
When students walked in today, they were again seated with a new group of people, and this time their warmup was Problem Set #1, which had 2 additional problems on identifying the Ws.  I gave the students 7 minutes to work the problems, then they had 2 minutes to share answers within their group, then 1 more minute to check their work with my answer key.  We briefly talked about the "Curve of Forgetting" and how doing this as a warmup boosted back their knowledge on the Ws and moved it to more long-term memory. 

Then we started in how HOW to collect data from an unknown population.  One suggestion is take a census, so students became "census-takers" and were asked to count the number of Gs in a story.  Here's 6th hour's results:


Students were shocked at how many different answers they had and even more shocked when they were told that no one had the right answer!  I wanted them to reflect on what they learned about a census from this activity, so I introduced a new thinking routine to them.  I asked them to "Pause and Think" and write down 2 things they learned from this activity.  After giving them time to process via writing, then they had to "Turn and Talk" and share their learnings with a partner.  After each partner shared out, then as a table group, they had to select one thing that their table would share out to the rest of the class.  The general consensus of all 4 sections was that "counting is hard!" and that "a census isn't as accurate as we thought it would be."

I then shared @gwaddellnvhs's graphic of a population/sample and talked about how a sample of the population does just as good of a job if the sample is representative of the population.  We watched this excerpt from the Against All Odds series on the Literary Digest poll of 1936 to illustrate the point that large samples do not always yield better results.  To finish out the hour, we again cracked open our books and summarized by answering a few questions on our Chapter 12 Introduction Sheet.

Favorite Comment of the Week:
On Friday, 5th period, I had a young man ask to use the restroom.  I looked at the clock and said, "You only have 2 minutes left in class.. can you wait?"  His response was, "Oh wow!  I had no idea class was almost over!  It went so fast!"

:)